What FOQA Actually Measures
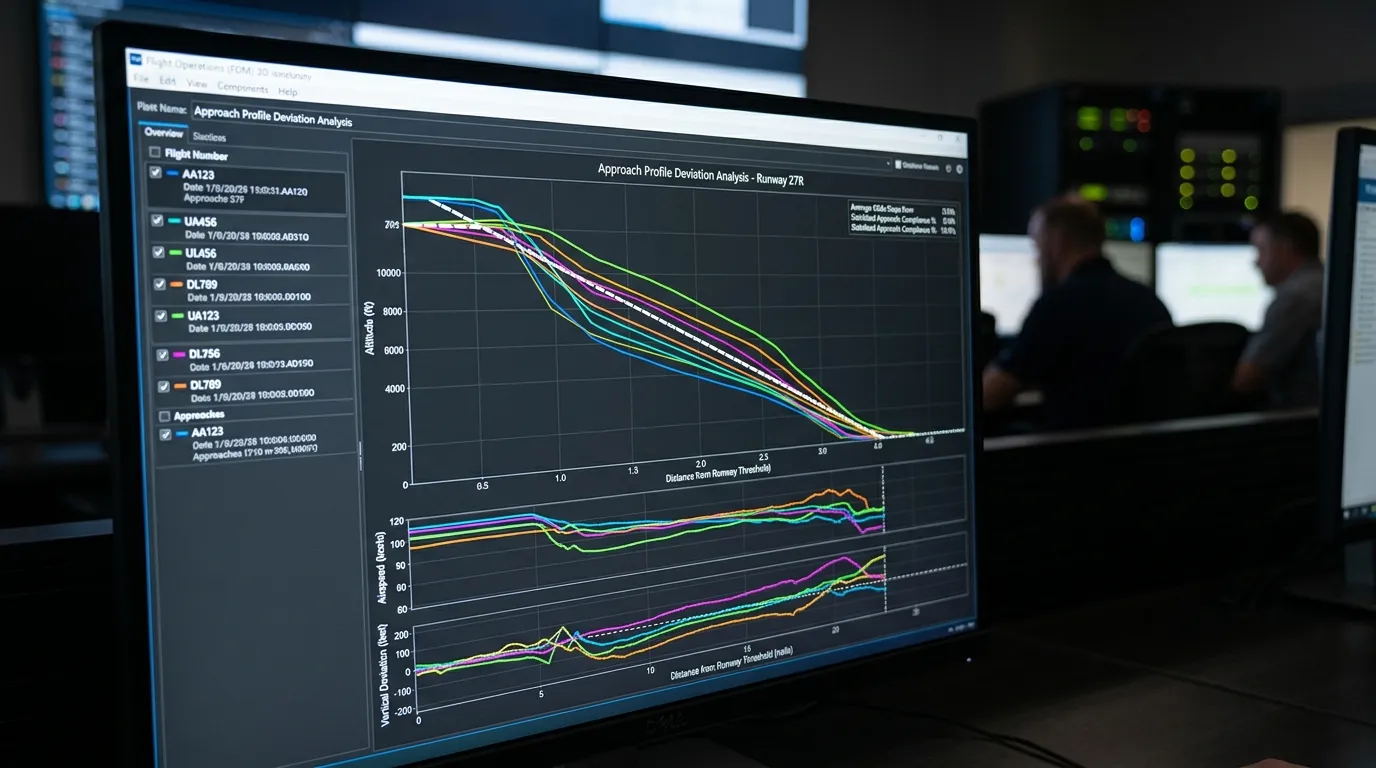
Flight Operational Quality Assurance (FOQA) is a voluntary program that records and analyzes flight data from every takeoff, en route segment, approach, and landing. The system captures 200+ parameters per second: airspeed, altitude, engine temperatures, control surface positions, rate of descent, G-loads, and geographic position. After each flight, the data downloads to a ground station where software flags deviations from predefined envelopes. An analyst reviews the flags, identifies trends, and feeds findings back to the pilot group and management.
Only 12% of U.S. Part 135 charter operators run FOQA programs as of 2026. Among Part 121 airlines, FOQA adoption exceeds 95%. The gap exists because FOQA is voluntary under Part 135, the programs cost $15,000 to $40,000 annually per aircraft to operate, and many smaller operators lack the staff to analyze the data. For charter passengers evaluating operators, FOQA participation is one of the strongest available signals of operational seriousness.
How the Data Collection Works
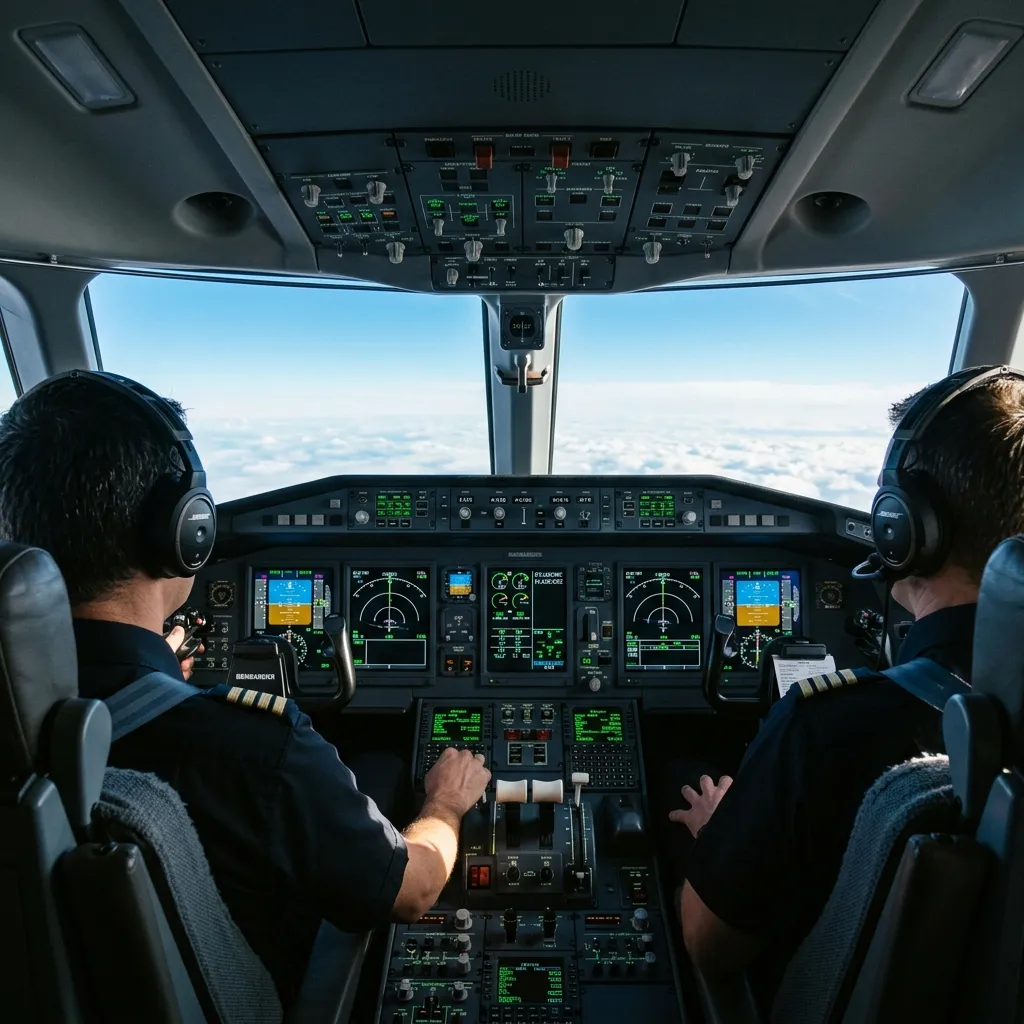
Modern business jets record flight data automatically through the aircraft's digital flight data recorder (DFDR) or quick-access recorder (QAR). The QAR is the data source for FOQA programs. After each flight, the QAR data is downloaded via a removable card, wireless link, or cellular connection. Some newer aircraft (Praetor, Latitude, G700) transmit data in real-time via satellite, enabling near-live monitoring.
Parameters Captured Per Flight
- Airspeed: indicated, true, ground speed, mach number
- Altitude: barometric, GPS, radar altitude during approach
- Engine: N1, N2, ITT, fuel flow, oil pressure, oil temperature per engine
- Control surfaces: aileron, elevator, rudder deflection angles
- Configuration: flap position, gear position, spoiler deployment
- Navigation: heading, track, lateral deviation, vertical deviation (ILS/VNAV)
- Performance: rate of climb/descent, G-loads (vertical and lateral)
- Geographic: latitude, longitude, timestamp
The raw data is processed through event-detection software. The software compares each parameter against a set of operator-defined limits. An unstabilized approach below 500 feet AGL, a hard landing exceeding 2.0G, an airspeed exceedance above Vmo, or an engine temperature exceedance above redline all trigger events. Events are categorized by severity and logged for review.
Safety Impact: The Evidence
The FAA and the Flight Safety Foundation have published multiple studies linking FOQA adoption to measurable safety improvements. The most cited finding: operators with active FOQA programs experience approximately 40% fewer unstabilized approaches and 35% fewer hard landings than comparable operators without monitoring. These are precursor events, not accidents, but reducing precursors is how aviation prevents accidents.
FOQA does not prevent a single accident by itself. What it does is make invisible patterns visible. A pilot who consistently flies approaches 5 knots fast may never have an incident, but the trend indicates a training gap. FOQA identifies that pattern after 10 flights instead of waiting for the 200th flight to produce a runway excursion.
The safety improvement comes from two mechanisms. First, pilots who know their flights are monitored fly more precisely. This is the observer effect and it is well-documented. Second, the data identifies systemic issues, like an approach procedure at a specific airport that produces consistently high descent rates, that individual pilots may not recognize because each flight feels normal to them.