Q1 2026: The Numbers Behind the Slowdown
On-demand charter flight legs in the United States fell 8% year-over-year in Q1 2026, according to preliminary data from ARGUS TRAQPak and WingX. The decline concentrated in the light jet and midsize categories, which serve corporate travel most directly. Large-cabin and ultra-long-range charter hours declined only 3%, suggesting that high-net-worth personal travel continues while corporate discretionary travel contracts.
13.2%
Pre-Owned Inventory Rate
$5.85/gal
Avg Jet-A Price (Q1)
+3.4%
Fractional Hours YoY
The decline is not uniform across the market. Fractional ownership programs (NetJets, Flexjet, PlaneSense) reported a 3.4% increase in occupied hours during Q1, indicating that committed buyers are flying more while discretionary charter clients pull back. Jet card utilization held flat. The clients who pre-purchased hours are using them; the clients who book ad hoc are postponing.
Tariff Uncertainty and Corporate Travel Budgets
The primary economic headwind is uncertainty, not recession. U.S. GDP grew at an annualized 1.8% in Q1 2026, down from 2.4% in Q4 2025 but still positive. Unemployment held at 4.1%. Corporate earnings were mixed. What changed is confidence. The escalating tariff environment, with new levies on European manufactured goods and retaliatory measures from the EU, created a decision paralysis that hit corporate travel budgets before it hit revenue.
Fortune 500 CFOs surveyed by the NBAA in March 2026 cited 'policy uncertainty' as the primary reason for reducing business aviation utilization in Q1. Not cost. Not demand. Uncertainty. When a CEO does not know whether their next quarter's COGS will increase 8-15% due to tariffs on components, the instinct is to cut visible discretionary expenses, and the corporate flight department is the most visible discretionary expense in any C-suite.
The jets are not grounded because companies cannot afford them. They are grounded because companies cannot predict whether they will need them.
Pre-Owned Inventory: The 13.2% Signal
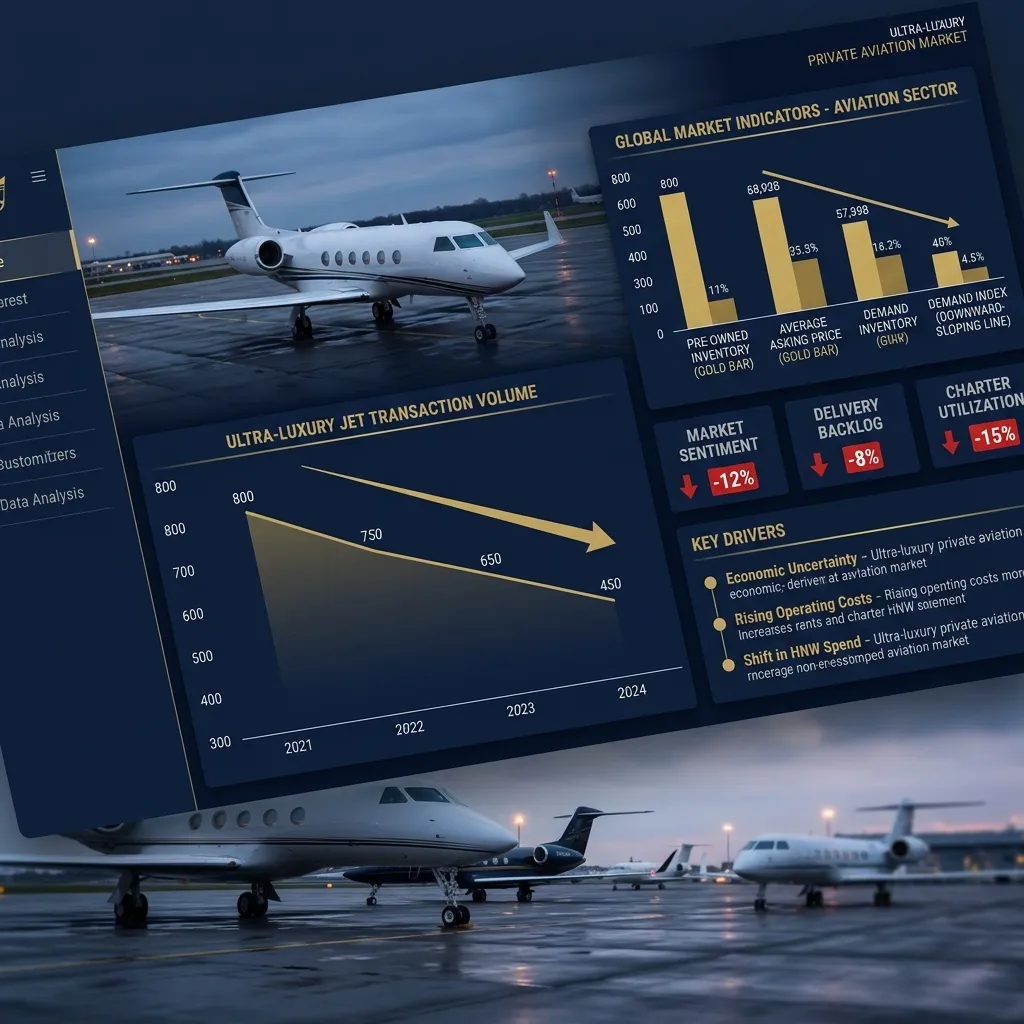
Pre-owned business jet inventory for sale climbed to 13.2% of the active fleet in April 2026, up from 11.8% in January and 8.4% at the 2022 post-pandemic low. The historical equilibrium sits around 10-12%. Above 12%, the market favors buyers. Below 8%, sellers set terms.
Where Inventory Is Building
- Light jets (15.1% for sale): The most oversupplied segment. Citation CJ2s and CJ3s built 2005-2012 are the hardest to move. Pre-owned Phenom 300s under 5 years old sell within 90 days; 15-year-old CJs sit for 6-12 months.
- Midsize jets (14.3% for sale): Hawker 800XPs and Citation Sovereigns dominate the for-sale inventory. No new midsize production means the segment is aging without replacement, depressing values on older airframes.
- Super-midsize (10.8% for sale): Tight supply relative to other categories. Challenger 350s under 8 years old remain in demand and sell near asking price.
- Heavy/ULR (11.5% for sale): G550s are the swing factor. Early-serial G550s (2003-2008) are approaching 12-year inspection intervals that cost $2-$3 million, pushing some owners to sell rather than reinvest.
For charter clients, rising pre-owned inventory is indirectly positive. As more aircraft sit unsold, owners place them on Part 135 charter certificates to generate revenue during the holding period. This increases charter availability and moderates pricing, particularly in the light and midsize segments.
Market Timing Matters
Current market conditions favor charter clients. Availability is high and positioning fees are competitive.
Get a Quote →Fuel Costs: Stable but Structurally Higher
Average Jet-A fuel prices in Q1 2026 settled at $5.85 per gallon, down from the $7.20 peak in mid-2023 but 40% above the $4.15 average of 2019. The stabilization reflects a balanced crude oil market ($72-$78 per barrel WTI) rather than any fundamental reduction in aviation fuel costs. FBO fuel margins remain elevated, with the spread between wholesale Jet-A and FBO pump prices running $1.80-$2.50 per gallon.
SAF (Sustainable Aviation Fuel) availability expanded to 18 U.S. airports in Q1 2026, though SAF pricing at $8.50-$10.00 per gallon limits voluntary adoption to operators with ESG mandates from corporate clients. European SAF mandates (2% blend minimum under ReFuelEU) began enforcement in January 2026, adding $300-$500 per transatlantic flight for operators positioning to or from EU airports.
What Is Holding Steady: Personal Travel and International
The charter market's 8% overall decline masks a divergence. Corporate charter bookings fell approximately 12%. Personal/leisure charter bookings rose 2-3%. The high-net-worth individuals who charter for family vacations, event travel, and real estate tours are not the same economic actors making corporate travel budget decisions. Their spending correlates with asset prices (equity markets, real estate), not corporate earnings forecasts.
- South Florida: Charter demand to OPF, FXE, and PBI remained within 5% of 2025 season levels through March 2026. Art Basel week set a new record for FBO movements at Opa-locka.
- Mountain destinations: Aspen and Jackson Hole reported record private jet traffic during the 2025-2026 ski season, driven by a strong snow year and new FBO capacity at both airports.
- International: Transatlantic charter hours grew 6% YoY in Q1, led by London, Paris, and Dubai routing. Tariff-related diplomatic and business travel partially offset the domestic corporate decline.
- Medical transport: Air ambulance and medical transport flights grew 9% YoY, a structural trend driven by aging demographics and expanding telemedicine-to-transport referral networks.
The market is not contracting uniformly. It is redistributing. Money is moving from corporate discretionary to personal lifestyle, from domestic short-haul to international long-haul, and from ad hoc charter to committed programs.
H2 2026 Outlook: Three Scenarios
The second half of 2026 depends almost entirely on tariff resolution and Federal Reserve rate policy. Three scenarios bracket the range:
- Tariff de-escalation + rate cut: Corporate travel budgets reopen in Q3. Charter demand recovers 5-8% from Q1 lows by year-end. Pre-owned inventory stabilizes near 12%. Fuel prices hold steady. This scenario resembles the post-2019 normalization.
- Status quo: Tariffs remain in place, rates hold flat. Charter demand stays soft through Q3, with a seasonal uptick in Q4 driven by holiday travel. Pre-owned inventory drifts to 14-15% as owners decide to sell rather than wait. This is the base case.
- Escalation + recession signal: Additional tariffs trigger supply chain disruption. GDP contracts in Q3. Charter demand falls 15-20% from peak. Pre-owned inventory spikes to 16-18%. This scenario has not materialized but is priced into owner behavior, which is why inventory is already climbing.
For charter clients, the current environment is favorable. Availability is higher than at any point since 2020. Positioning fees have dropped as operators compete for fewer bookings. Empty leg opportunities have increased. The market is not in crisis, but it is in a buyer's cycle. That window may not last through year-end.